
We built our machine learning platform Helio to evaluate consumer brands across an array of different dimensions, and we’ve gotten pretty darn good at doing that. We can look at the branding, financials, distribution and other factors to assess the attractiveness of a certain company as an investment. But ultimately a great company is made up of great products and to truly understand what drives value for companies we also want to understand the components that go into those products. Sometimes that will be the packaging of a product, sometimes that will be its shape, sometimes it will be the ingredients or nutrition facts, and often it will be some combination of all these things.
We’ve written about our Product Model in the past, including our analyses of ingredients and labels. All of this work (and a lot more) has been consolidated, and today the model is basically a two step procedure. First, we identify groups of “exchangeable” products, or those that address a similar need. Second, we calculate the differentiation of a given product relative to others in its group based on its ingredients, nutrition, and packaging. A big learning from the past few months, which I want to share with you today, is that the first step—the grouping—is both hardest and the most critical to get right. I’ll share an approach we’ve been working on to make the process of grouping products more flexible and adaptive.
Older versions of the model relied heavily on pre-fabbed, static product groupings that we adapted from major retailers or data providers. These groups are a reasonable place to start, but they have drawbacks. One issue we found is that the groups lag behind industry trends – e.g. Kombucha beverages may be placed into carbonated drinks or teas, rather than a subcategory of its own. Another issue is that our investment team often wants to compare a single product to multiple groups. For example, Barnana Chewy Banana Bites can be naturally grouped along with either dried fruit or candy. And why pick when you can have both?! Our new approach addresses both of these limitations. Rather than anchoring on external taxonomies to define the groups, we define them dynamically based on the raw constituents of the product—its ingredients. In the future, we plan to incorporate other characteristics, such as nutrition facts, claims (e.g., gluten free, organic), and packaging elements as well.
Now before we get too deep I do want to say that this is very early days for the model I’m about to show you. One of the things that always keeps you on your toes with data science is that you don’t often know where a model is going to take you. We may end up using this model extensively, or we may end up just taking some pieces of it to inform other parts of our work. I didn’t want to let that stop me from showing you some early outputs that I thought were cool.
Clustering Products By Ingredients
To group products by their ingredients, first we need a way to quantify an ingredient list. The old way I thought about ingredients was in a binary fashion, either a product had a certain ingredient “1” or it didn’t “0”. This was pretty convoluted and didn’t lead to the best results (see curse of dimensionality):
Product: [0, 0, 0, 0, 0, 0, 0, 0, 0, 0, 0, 0, 0, 1, 0, 0, 0, 0, 0, 0, 0, 0, 1, 0, 0, 0, 0, 0, 0, 1, 0, 1, 0, 0, 0, 0, 0, 0, 0, 0, 1, 0, 0, …, 0, 0, 0, 0]
To simplify this extremely long list of features, while preserving some degree of interpretability, I had an idea of grouping ingredients by 15 custom-defined features. Our legal team will get mad at me if I share too much, so I’ve hidden the names of the features for now. I will tell you that one of the features is “grain” to give you an idea of the type of thing we’re talking about. Any ingredients like oats, rice, barley, etc. would flag for the grain feature. The new version looks more like this:
Product: [0, 1, 5, 10, 1, 0, 0, 3, 1, 2, 2, 3, 0, 1, 0]
The numbers now represent how many ingredients in a product fall into each feature, and ingredients may end up in multiple features. When you control for the total number of features by dividing each number by the total, this becomes:
Product: [ 0, .07, .33, .67, .07, 0, 0, .2 , .07, .13, .13, .2 , 0, .07, 0]
In this case, 67% of all ingredients in the product flag for whatever feature 4 is. On an individual basis, the pairing by features looks like this.
Ingredient Clustering 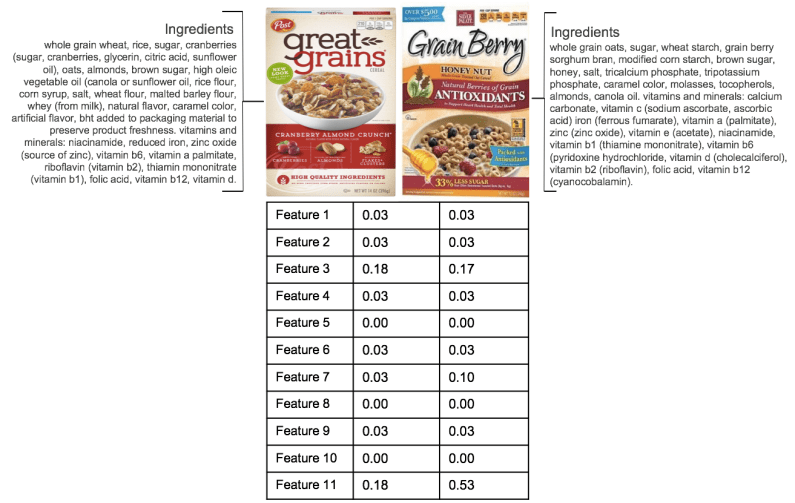
Only 11 out of the 15 features I mentioned were relevant for the cereal category, but you can see that the two cereals shown above had a very similar weight of features, except for Feature 11. Conceptually, the model would tell us that the products should be very similar and indeed they are.
Building this idea out, I ran the model on 2,800 cereals and clustered them by features, using hierarchical clustering on a euclidean distance matrix. The cereal category also includes granola and cereal like snacks, which we’ll explore below. Each vertical line represents a different cereal and the Y-axis represents 11 of the 15 ingredient features noted above. The lighter the blue and higher the number, the more present the ingredient is.
Cereal Clusters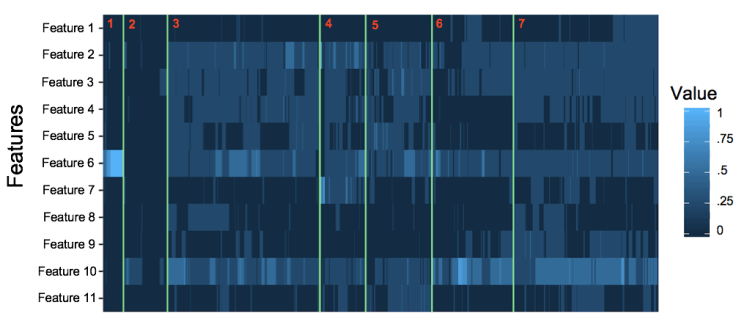
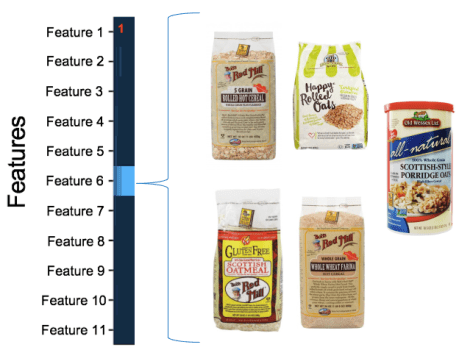
I’ll give a little hint again and say Feature 6 is grain. If we zoom in on cluster number 1 (as marked by the red number) we’ll get all the cereals that just have grain in them. For simplicity, I’m going to show just five of those cereals. I promise I didn’t cherry pick examples here, so you can see that the model did a pretty good job of grouping similar products! I added the “Just Grains” label based on the type of products that were surfaced in this cluster.
Cereal Cluster 1 “Just Grains”
If we go to cluster 3, you can see that the ingredients are spread across a wider array of features. These ended up being more complex grain snacks.
Cereal Cluster 3 “Complex Grain Snacks”
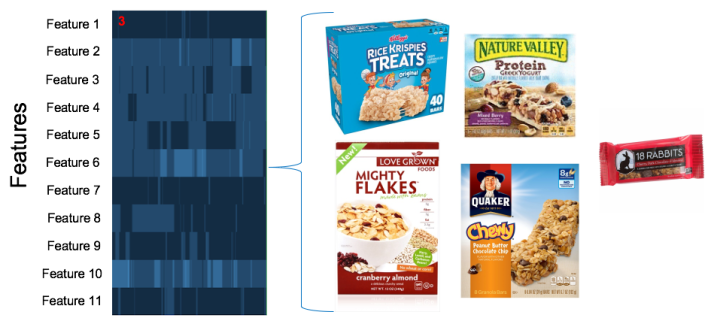
You might be surprised to see that the model flagged Rice Krispies Treats as being very similar to Quaker Chewy bars. I was surprised myself so I looked up the nutritional facts for both products just to be sure. It turns out that the ingredients are basically the same. An unexpected benefit of this model is that it can help tell you things not to eat!
Ideas For This Model
The next step for this model is to add other product characteristics (e.g., nutrition facts and claims) and see how this impacts the clustering. We can also use these features and the corresponding product similarity matrix to pick the top-N most similar products to a given product. The latter use case is ideal when we already know the product we need a competitive set for, such as when our discretionary fund is evaluating a product in relation to its cohort.
One thing to consider when building comp sets based on product characteristics is that products within a comp set will naturally be similar when measured along those characteristics—that’s the idea after all! Therefore, we will probably exclude some product characteristics from the comp set creation process, and reserve them solely for evaluating product differentiation within the cohorts. Maybe we will define cereal cohorts using ingredients (to separate “just grains” from “complex grain snacks” and “cereals”) and define product differentiation by reference to claims, such as whether a product has “organic” ingredients or is “gluten free.” One way or another, we think decomposing a product into its underlying traits is important step in making Helio more powerful, scalable, and adaptive. You might even say it’s a key ingredient.