/Hero%20Backgrounds/Gradient-Sun-med-1900x1080.jpg?width=300&name=Gradient-Sun-med-1900x1080.jpg)
Big consumer goods companies like Unilever and Nestle understand how to use sales data to get more shelf space (which in turn gets them more sales, thus better performance data). Small, growing consumer goods brands rarely tell their own stories using data, which makes it hard to truly break through the clutter and grow.
Growth Analytics tell the story of your performance to a retail buyer using many different metrics, but all toward the aim of convincing the retailer that you will help their aisle sell more. Some key areas include:
Sales Metrics
A growing brand probably won’t outsell the largest products in the retail set. But, different data cuts can showcase your performance in the best light. Consider all the possible ways to look at the data – which include
- Time periods- Weekly data, vs last 12, 26, 52 weeks, vs prior year
- Geographies- Did you perform better in a geography where you were displayed properly?
- Metrics – There are an almost unlimited set to choose from, but sales per store selling is a great way to show how much you’d sell if a retailer gave you broader distribution!
- Comparison set – Whittle it down: by product type, package size, flavor, etc.
Category Growth
Retail buyers care about how much their aisle will sell in total and much less about whether they sell your brand or your competitors’. You want to show them that you won’t just steal market share from other brands they happen to carry, but that you will help them sell more overall.
Space Productivity
Buyers have a fixed amount of space to place products. If you can do ‘more with less’, you can make a data-driven argument for better or more space for your product. If a brand earns an additional ‘facing’ (i.e., an extra spot for the same product), sales could increase, potentially by as much as 20%. That sales performance boost will help you get into other retailers and make the case for more space there as well!
Panel Data
Many companies like Nielsen or IRI can provide you with household pantry (“panel”) data that can show your impact on shoppers. Perhaps you sell very well with the demographic a buyer cares most about, or you can prove that your brand is the strongest at convincing people to start buying that type of product again.
NatureFizzPop Case Study
The following hypothetical case study illustrates a strong data-driven argument to win more space.
NatureFizzPop is a zero calorie beverage with natural sweetener. It launched two years ago and has grown steadily, although not as quickly as the founder had hoped. In the past, the CEO would show up to meetings well prepared to talk about the mission and product, but something was missing. Now, before the next meeting with the buyer at their largest account, the CEO invested in a data based story centered around the following:
Sales Metrics
NatureFizzPop’s CEO was at first discouraged to see that at this retailer, her product ranked 10th in total sales over the past year. However, sharpening the data allowed her to change the narrative:
Time
- Looking at the last 26 weeks instead of 52 weeks showed much better and truer performance – likely because the company had supply chain issues the first part of the year.
Geography
- While showing total retailer performance, the team highlighted how in the West Coast stores of this retailer, their performance was much stronger. The team believes this is because on the West Coast, the retailer had given them more favorable shelf space.
Metrics
- NatureFizzPop was only sold in 2/3rds of stores for much of the year, so total sales were not that compelling. And they are lower priced than some competitors, so units looked better than dollars. Thus, “units sold per week per store selling” was the best metric to showcase performance
Comparison Set
- The total ranking was against all carbonated drinks. But a much more relevant set could be low calorie, and perhaps only 12 packs, as a lot of evidence shows that consumers always buy the same package type (i.e., foregoing their favorite brand in a 2 liter to instead have the convenience of cans).
Category Growth
NatureFizzPop had achieved 15% market share within the comparison set. While this alone is quite impressive, it was able to show that the set sold 5% more in the geographies where they were sold, and 10% in the West where they had additional shelf space, while the stores where they weren’t carried didn’t show any growth at all. This tied into their argument that they brought new consumers into the aisle who are excited about their new beverage even if they don’t typically buy soft drinks.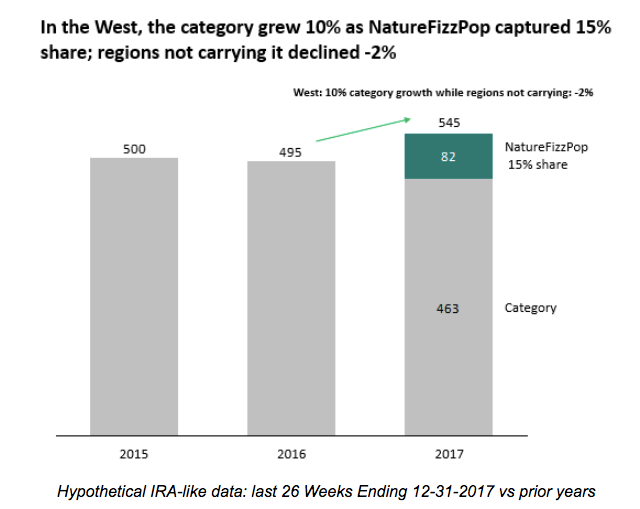
Space Productivity Analytics
The data showed that NatureFizzPop’s top performing product with just one “facing” (or shelf space) outsold some of the older brands that had 2 and 3 facings. Using a few assumptions, NatureFizzPop was able to estimate the potential increase in total aisle sales the retailer would enjoy by taking away a space from a competitor and giving it to NatureFizzPop.
The Case To Make
Using the above data, NatureFizzPop makes the case that they bring new customers into the aisle and expand sales for an entire set. They argue that they are more productive with facings than many other products in the set and will earn more in total sales for retailers where they have additional shelf space. They back up this claim with their space productivity analysis and the data around the increase in sales they bring for the entire set on the West Coast.
This is one example of how your brand can think about using different slices of data to make a compelling argument to win more shelf space from retailers.
Daniel Scharff is the Director of Revenue & Margin for a Bay Area Food Technology Startup. His articles on Consumer Pricing & Promotions can be viewed at www.consumerledpricing.com, and he welcomes inquiries to daniel@consumerledpricing.com