
“So, how does your growth compare to the industry median?” your potential investor asks. He waits on your video screen. Blinks.
You hadn’t prepared for that question.
You consider slowly closing your laptop and pretending that the power cut out.
Luckily, there’s something you can do to avoid that stomach-dropping moment. Investors will begin asking questions in the first due diligence discussion with your company — they may be on the other end of the phone, they may even have traveled to your office to talk to your team in person. While their questions will vary according to what your company does, there’s a core set of metrics that you can prepare that will form the foundation for due diligence.
Preparing these metrics is about more than just avoiding embarrassment. It’s about knowing why your company is great and having a plan for its growth.
After all, communicating to investors is about so much more than the right answers. When you have a clear understanding for yourself of your business metrics, you’ll be able to communicate better and tell a clearer, more compelling story about your company’s trajectory.
1. Net Revenue: Investors want to see actual dollars
Net revenue is the first thing that investors look at. It simply shows how much you’re selling.
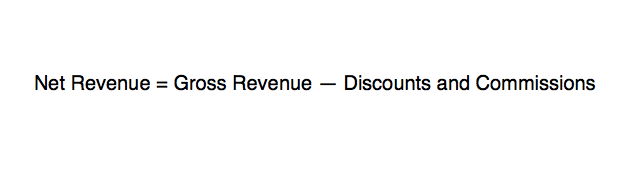
Investors focus on Net Revenue as opposed to Gross Revenue because it considers discounts, returns and commissions, so the investor can see the actual dollars your company is bringing in.
How to calculate Net Revenue
Expect to be asked
Investors will diligence different Net Revenue figures:
- What was your Net Revenue in the last 12 months?
- What is your forecasted (budgeted) Net Revenue for the next 12 months?
- What is your forward (projected) Net Revenue for the next 3 years?
These three figures combine to show what your Net Revenue looks like over time. Investors will want to see that your discounts and commissions aren’t the only things fueling your growth, and that over time, net sales are expected to increase.
Furthermore, expect investors to drill down into these figures to see how you’re generating sales:
- Where does your revenue come from?
Not all channels will be well suited to your particular product, so you have to show reasoning behind your channel choices. For instance, perhaps your sales look low across small retailers, but are thriving in e-commerce. Make sense of this for investors, in order to show how you’re shifting and honing your strategy to make your sales healthier, that you’re aware of where your sales comes from, and are driving forward with those channels that are most sustainable.
2. Growth: Show a pattern that leads to success
A track record of growth enables investors to evaluate their potential return on investment. It gives them evidence and insight for justifying a fair valuation. A $200K business that grew 100% last year will be perceived very differently than a $2.0M business that grew 100%, because investors don’t just look at percentage growth but dollar growth. Furthermore, investors don’t just look at historical growth — they need to dig in to how your company expects to grow and assess that the assumptions you’re making are achievable in reality.
How to calculate Growth

Expect to be asked
Investors will aim to understand the trajectory of your growth into the future:
- How much did your company grow last year?
- How much is your company expected to grow next year?
- What channels fueled or slowed your growth?
In addition, be prepared to compare this growth rate to other companies in your category and of your size.
- How does your growth compare to key competitors?
As Chris Pachinger, Director of Capital Markets at CircleUp notes, “A company growing from $500K to $1.0M is good. It’s just a bit lower than the CircleUp median for companies $1M and under. But a company growing from $1.0M to $2.0M is really impressive because it beats the median for companies of that size. Both companies are growing at 100% but the second company is beating the industry.”
Investors don’t look at companies in a vacuum. They’ll compare your business to others of your size and category to see whether you’re doing something differently, whether you’re out-growing or out-smarting the competition. Then they’ll dig in to why they’re seeing that comparative growth. They may ask:
- How will you grow the company? And what assumptions is your forecasted growth based on?
These questions drill down into how you plan to grow. You need to be transparent about the factors that influence your predictions. Does your growth prediction depend on you being able to roll out to a new location? Do you have a new product in the pipeline that you’re assuming will be ready to launch in time to affect next year’s growth?
Growth without context is meaningless. In order to replicate or expand on previous success, you need to understand how you’ve grown and be able to strategize for the future in light of a changing marketplace and industry landscape.
3. Gross Profit Margin: This is your financial IQ score
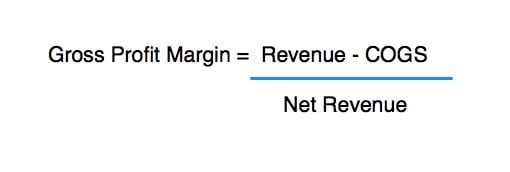
Your Gross Profit Margin tells investors how you squeeze profit out of sales. A growing Gross Profit Margin says that you’re effectively managing costs relative to sales. It shows investors that you’re more than just a vision for a great company — you know how to craft budgets and operate according to your means, all while scaling your business.
How to calculate gross profit margin
Expect to be asked
- What is your current Gross Margin?
- How does your Gross Margin compare to the industry standard?
More than just the calculation, investors will want to compare your margin to the industry standard. Use CircleUp’s data to take a look at your category’s median Gross Margin. For example, the median Gross Margin for beverage companies above $1M is 35%, while personal care is 53%.
If you’re a dairy brand with a complicated supply chain, you’ll be paying more for each bottle as you scale, but hopefully you’ll be able to show investors how that curve will level out, and how sales will start to climb, and decrease cost per unit sold. That’s why you should also prepare the follow-up question:
- How do you plan to increase your Gross Margin over time?
Show how you’re maintaining margins across your distribution channels and SKUs, describe your path to decreasing COGS, and how your proposed changes will affect Net Revenue to drive up your Gross Margin. For example, a beverage company that decides to switch from glass bottles to plastic can show how it’s aiding Gross Margin as follows:
- Current: $5 beverage – $3 COGS = $2 Gross Profit = 40% Gross Margin
- The plastic bottle costs $0.40 less for raw materials and $0.60 less for direct labor to make
- Predicted: $5 beverage – $2 COGS = $3 Gross Profit = 60% Gross Margin
This is about more than just that 20% extra. It’s about knowing which steps to take now in order to grow your business in the long term and shows that you have a thought process that’s constantly improving and optimizing revenue. This material shift might be a temporary cost-cutting solution, but it will boost margins overall, and allow the beverage company to invest in research and development to innovate new flavors in the future.
4. Points of Distribution and Velocity: Build a heatmap of your product
You can think of Points of Distribution and Velocity as a pair of metrics that give investors a heatmap of where your products are being sold and how often they’re selling in those locations. Not every brand will be aiming for world domination, but it’s important that you’re scaling in some way, whether it’s by increasing local retailers or achieving more and more market share in your stores.
How to calculate Points of Distribution
Points of Distribution is simply how many “doors” (stores, locations) your product is sold in.
How to calculate Velocity

Expect to be asked
- How many doors are you sold in?
- What are your distribution channels? (i.e. specialty, mass, conventional grocery, online)
- What is your average velocity within different revenue channels?
These are the basic questions that will give investors the lay of the land where your product is distributed and sold. But the most important questions are the ones that drill down into how that map is evolving:
- How many doors do you expect to be in next year? How will you get into them?
- What is the size of the untapped market? (i.e. How many doors could you be in in the future?)
For investors, it’s important to see not just that you’re getting into doors and selling — they also want to see that you’re in the right doors for your brand. If you’re a premium ice cream brand and you’re not selling in stores where premium ice cream shoppers are shopping, this is an opportunity to shift your strategy. If you are selling in those upscale groceries, and selling well, perhaps you’re poised to become a dominant player in the market with the fuel this fundraising round provides.
Tell Your Story by Numbers
Demonstrating that you know your core metrics inside and out shows investors that you understand how your business is growing and have thought deeply about how you plan to grow it in the future.
The benefit of digging in to these four metrics is that it also forces you to dig in to the context behind the metrics, the strategies you’ll use to boost or decrease them, the external factors affecting them, and how they stack up to your competition.
Knowing that you’re able to answer investors’ questions when they inevitably arrive, you can focus your energy on telling your story. Bring these metrics to life — illuminate the customers that contribute to your shelf velocity, letting you imagine how your company will look in a year’s time given your current growth rate. When you have a solid foundation of financial metrics that spell out your business’s health to investors, your vision now has a pedestal on which to shine.