
Some believe that AI alone will solve age old problems – that enthusiast who watches every single show Netflix recommends. Others trust their own judgement over the recommendation of machines – that cab driver that takes a “secret shortcut” even though Google Maps tells him/her it’s slower. At CircleUp, we believe that it’s the combination of human hypotheses and algorithmic objectivity that are stronger together than the individual parts. Chess grandmaster Garry Kasparov, who famously lost to IBM’s supercomputer in 1996 and again in 1997 has said, “In a match of human-plus-machine versus the most powerful machine, the former combination will win because human advice in a very special situation could be vital.” You can see our philosophy reflected in both our discretionary and systematic funds. Both combine technology and human judgement.
The same holds in industries ranging from neuroradiology to airplane piloting. What machines lack in creativity, intuition, and connection, they make up for in computational power, structured problem solving, and objectivity. Mary Cummings, of the IEEE Computer Society has said, “Allowing the human to coach a highly-automated system produces results up to 50% better than if the automation were left to its own devices. Collaboration between humans and computers, particularly in knowledge-based domains where complementary strengths can be leveraged, holds much future potential.”
At CircleUp, we apply the strengths of human-plus-machine to private investing.
One way this manifests itself is in our hypothesis testing capability, where we leverage human heuristics to prioritize what we’d like to test. There are two concepts in this statement alone that are important to define.
- Testing: In our context, testing can range anywhere from prototyping for signal to model construction to model optimization. We leverage human heuristics across every single one.
- Capability: By capability, we mean a defined, tested, and repeatable process that has stand-alone value for CircleUp and others.
To illustrate this capability, we’ll dive into one simple (and not particularly original) example related to category dynamics and how they influence our diligence of emerging brands in the CPG space. A common category-specific strategy to identify attractive companies is as follows:
Breakout brands are common when…
- There is a large future addressable market
- The current addressable market is growing quickly
- A company in the market demonstrates strong sales momentum
To test this hypothesis, we want to quantitatively backtest the effectiveness of this strategy and compare it to a benchmark of some sort.
- Effectiveness measure: The strategy’s results demonstrate that by using the thesis above to screen for attractive companies, we are 9.5x more likely to identify “breakout brands,” and 50% less likely to see unsuccessful brands.
- Benchmark measure: In the spirit of simplification, we’ll benchmark against a random-pick strategy, although we recognize this is not representative of what we are trying to outperform.
The Details:
Leveraging our own distribution data as well as Nielsen’s RMS data (through the Connected Partner Program), we start to unpack these hypotheses. Note that CircleUp’s distribution data covers the long tail of both retailers and companies. The graph on the left hand side establishes our status quo. On average, what does sales growth look like over time for our cohort of emerging brands that started in 2013 (red line)? We notice that most companies are clustered around the red line, illustrating that companies remain stagnant over time, on average.
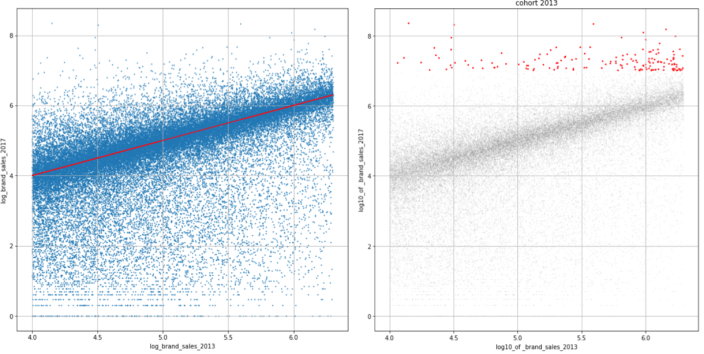
The graph on the right hand side establishes our target set of brands. These “breakout brands” (in red) mark what we’d like any investing strategy we test to disproportionately capture, as they’ve demonstrated substantial growth. In a similar vein, the effectiveness of any investing strategy also includes how many unsuccessful brands (those on the bottom) we can avoid.
Recall the hypothesis to be tested:
Breakout brands are common when…
- There is a large future addressable market
- The current addressable market is growing quickly
- A company in the market demonstrates strong sales momentum
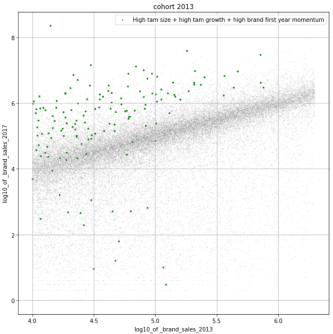
To gauge the effectiveness of this hypothesis, we create a composite score for each brand that builds in each component of the strategy above. From here, we sort on our composite metric and compare our top scores (green dots) to the established set of target brands (red dots). Unsurprisingly, we’ve validated this hypothesis-driven strategy and conclude that it’s a decent one. But our work doesn’t stop here.
Although we leverage human heuristics to prioritize model construction and influence feature engineering, we believe in taking an exclusively data-driven approach to algorithmically determine what category factors are indicative of emerging brand growth. By adopting heuristically-motivated features into this work – such as the shift in market share from incumbent to emerging brands – we are able to effectively tie traditional investors’ expertise with an objective analysis. We go on to examine the interaction effects amongst a set of variables dually created by both human and machine to identify the category dynamics that are most conducive to breakout success.
We won’t share the proprietary details of the entirety of features or the analysis’ findings here, but rest assured that this is where the machine outsmarts the human alone and where large volumes of data can disprove assumptions that investors have held for decades. With this capability to prioritize, test, and validate assumptions, we find exciting opportunities to not only tell stories with data and but also rethink traditional, incorrectly-held assumptions.